#JulyByWomen Statistics

Metafilter is a site where interesting links are discussed. You have to pay $5 to sign-up to comment and the site actively moderates discussions, so the discussions tend to be thoughtful. Earlier in 2014, some heated discussions about sexism led me to wonder exactly how many women were posting and commenting on Metafilter. There had been some statistics gathered through surveys that pointed to a 40-45% women:men ratio but as Metafilter doesn’t require or track a gender field on accounts, no-one really knew.
Fortunately, I was sick in June and mostly staring at a wall for hours each day. Perfect for data processing. I ran some rough calculations that suggested that while about 40% of Metafilter members are women, far fewer post (8-20%) and women tended to comment less than men. This was discussed in the Revisiting misogyny on Metafilter thread and led to a small idea: what about a month of encouraging women to post with a tag, #JulyByWomen?
The #JulyByWomen project started as a thread on Metatalk with the hopeful goal of doubling women’s posts in July with an additional 90 posts. We ended up with 428.
So here are some statistics on what was a wonderful month with amazing posts by hundreds of women, making Metafilter even better. Thanks to everyone who took part, supporting and posting and commenting. (And here’s the wrap-up thread on metatalk, notes on how I compiled these stats are at the end of this page.)
The Main Numbers
 |
|
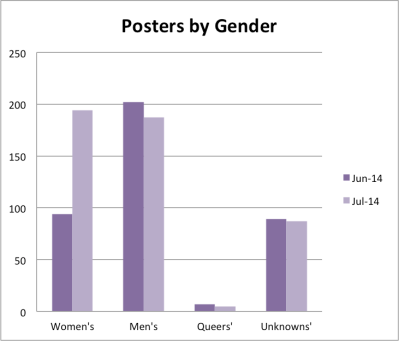
| Women posted way more in July 2014 than the month before. The other gender groups stayed the same or for men, slightly down – possibly as some prolific posters who are men stepped back in support of #julybywomen. | |
 |
|
| Some women chose not to use the #julybywomen tag, or on only some of their posts. The three posts with the highest comments (two, the highest overall this month) by women did not use the #julybywomen tag at all. Some reasons given in the threads were women who already felt comfortable posting to metafilter and women who did not want to mark their posts by gender, among others. | |
> |
|
| There were 15 people who posted to metafilter for the first time in July, 9 of them women who all used the #JulyByWomen tag, and two of them going on to post again. | |
 |
 |
| People who hadn’t posted in at least a year came out significantly in July – 117 returned posters, compared to 72 in June, nearly 60% higher. And most of the renewed posting came from women, many of whom used the #JulyByWomen tag. | |
 |
|
| This data’s a bit rough as only about 25% of commentators were tracked for gender. There was a big jump in the participation by women in comments on the site, partly on posts by women in July 2014, but fairly spread out over all posts, as you can see in charts further down the page. Men still commented more overall, but the gap was significantly closed. | |
 |
 |
| Here’s the clearest picture of what posting looks like when it roughly aligns to the actual userbase. | |
 |
|
| Experience differs hugely between women and all other genders. I calculated the lifetime post count for every user I tracked, then compared that to the number of posts they made in June and July 2014. The lower your percentage, the more experience you have. If you had a 50% percentage for example, you had posted only once before. | |
 |
 |
| I’m putting these two side-by-side to address a question raised early in the project: did the extra posts change the volume at metafilter? In other words, were women’s posts crowding out other voices? Was it more quantity than quality?
Metafilter’s posting volume varies month by month. July 2014 was higher, but not high enough to be only the #JulyByWomen posts as a temporary bump. June 2014 was lower than average, so the #JulyByWomen statistics might seem artificially inflated, but I ran some back-of-the-envelope comparisons to July 2013 and the 2014-2013 year in general, and none of the gender posting ratios deviated as sharply as they did in July 2014. Metafilter has had busier and quieter months than July, but as far as I can tell, not a month with so many women posting. As for quality, the Comments ratio and Favourites ratio for posts mostly increased, and browsing through the July 2014 archive shows a huge range of topics. At the very least, there was no decrease in quality, and I would argue a definite increase. |
|
 |
|
| A better metric for comparing posting is the ratio of posts to posters, basically the average volume for each gender. The other three genders remained fairly similar, with on average two posts per active men posting. In July, women surged ahead thanks to several very active posters. | |
 |
|
 |
|
| I’ve put these under each other to make them slightly easier to compare. Basically, most people post just one front page post. A few people post way more. Before July, men were far ahead in each category. In July, women made far more single posts and held their own in the heavy posting categories too. | |
 |
 |
| Before we get to comments, what about favourites? Noticeably, they picked up sharply in July on posts by women, both in volume and the average of favourites per post – but only for women mefites. All other genders actually favourited less slightly. | |
 |
|
| I picked out the posts by women to see if favourites differed depending on the tag #julybywomen, and there was a clear jump of about 30%. This applied even when I excluded the heavily commented posts, possibly because they were topical news threads that are less likely to be favourited as a bookmark method. Favouriting has been used informally as a way to feedback praise and support for a post, so this jump was likely a sign of support for the #julybywomen project. | |
 |
|
| Here you can see that most metafilter posts in July (and when I compared to other months, this is a little better than typical) are under 100 comments. This is a snapshot on 3 August, so the volume is lower for newer threads. Women posted the threads with the most comments (MH17, the World Cup and gun control) and most threads ran 20-70 comments long. | |
 |
 |
| There’s a massive swing in volume of comments made at posts by women, mostly seeming to come from decreases in mens and undetermined posts. However, it’s not quite that simple. First, overall volume was up in July, with three women-written posts leading overall comments.
Then looking at the second chart showing the ratio of Comments to Posts, you can see that there was a decrease in the average comments per post for every gender group in July, possibly because there were just so many posts in July that people’s attentions were divided. The drop was sharpest for undetermined/unknown gender, and posts by men. |
|
 |
|
| This chart is a bit complicated. Starting with women, you can see that the largest proportion of comments women make are on other women’s posts. This same gender preference holds true for men on men’s posts, queer on queer posts and even oddly enough, undisclosed on undisclosed. We seem to unconsciously gravitate towards our own gender’s posts and discussion. | |
 |
|
| Comparing comments on posts by women, the #julybywomen tag at first seems to lead to a lower discussion ratio. However, when I excluded the top three outlier posts (MH17, World Cup and gun control) that had come to nearly 10% of all the comments on women’s posts, the #julybywomen tag slightly boosted the discussion ratio. | |
Number crunching
You got all the way down here? Congratulations! Here’s where I got the numbers.
The raw data came from the wonderful infodumpster, a very neat project by Metafilter that takes the public site data and puts it out to be crunched each week.
However, this doesn’t include gender. What I did was create my own gender list mapped to the userids. I pulled all the unique userids for July and June 2014, arranged them alphabetically and then went to their profile page. I could have – and in hindsight, should have! – scraped the gender entry, but even that only worked about 5% of the time as it’s a freeform entry and people enjoy putting funny comments there.
I worked out gender from the profile page for about a quarter of people, then participation in #julybywomen helped me identify more women. Some people wrote to me with their gender. For everyone else, I went to their website or twitter linked from their profile page, or I looked at their recent activity page. I kept my search to the first page of results to not be creepy.
I tried to be as inclusive as possible for Queer, so anyone who mentioned gender-flexibility was marked as Queer. Trans people were marked by the gender they chose for their profile/activity. I didn’t assume marriage or parenthood implied gender roles unless specified.
I don’t plan on releasing the gender list publicly, although I can memail the spreadsheets to other mefites, as there are quite a lot of people who do not list their gender on their profile by choice, although I was able to track their gender readily from activity.

Outstanding work! Thank you for this thoughtful and detailed analysis.